A Very Cool Google Infographic Chart

Infographic is portmanteau for Information graphics, which shows information and data in an easy-to-understand manner. And we all know, there is more to Google than meets the eye. For this reason, our favorite website monitoring service – Pingdom have come up with a very cool Google Infographic chart with a ton of facts and figures on Google. Let us have a look at it:

(large resolution flickr image here)
Some interesting facts shown up here are :
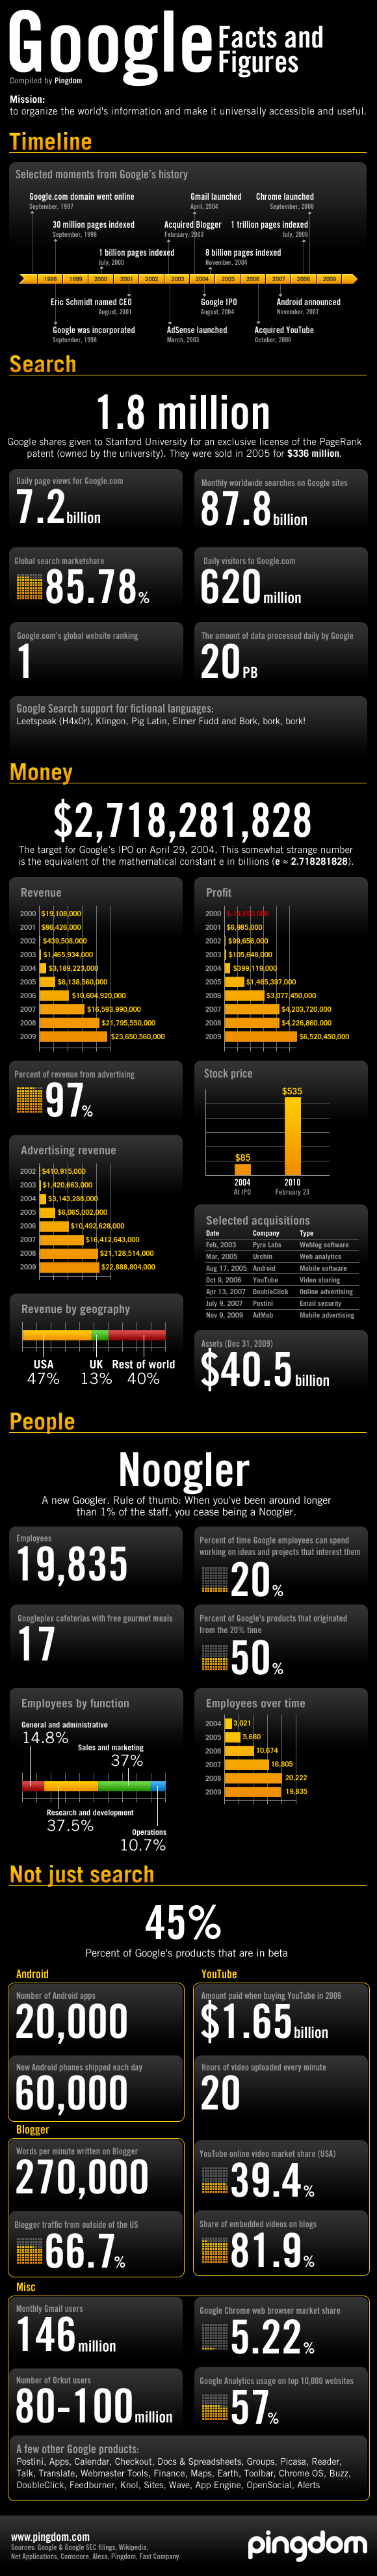
#1. Google processes almost 20PB of data daily. 20PB (Petabytes) = 20,971,520 GB (Gigabytes)
#2. About 270,000 words are written in blogger per minute.
#3. 20 Hours of videos is uploaded in YouTube every minute.
#4. 50% of Google’s product originated from that 20% time which employees are free to work on. (Remember, we have already told you about this 20% time in our Google facts post).
#5. 45% of Google’s products are in beta.
Hope you will find this post interesting. Then why not share it?
Related: Interesting Google Facts


Love it. Now I understand Uncle G more… Yupe, have already shared it in my FB.
There is definately more to Google than meets the eye.